You need to add chart to you ionic angular app. What are the options.
Ngx Charts
It has a great online demo. Looking at the demo you have dozen of different chart choices. From Bar Chart to Line Chart to Pie Chart. I think it also comes with two color schemes i-e Light and Dark.
Adding Ngx Charts to your Ionic App
Ngx Chart uses d3 behind the scenes, it’s kind of an angular wrapper around d3 with some svg animations. It’s documentation is very straight forward on how to install it to your app. I tried to install it but it had some weird dependency issues that I could not solve. That’s why I have skip it and found ng2-charts.
Ng2 Charts
It uses canvas unlike ngx charts which uses d3 and svg. Actually you can achieve much more with d3, you could visualize a data in any form and add interactivity. That’s why it has steep learning curve. For simple charts I would go with Ng2 Charts
Adding Ng2 Charts to your Ionic app
From it’s documentation, It starts nicely with how to add it to your project. Followed how to use the Api. It comes with all the basic chart options is that Bar, Line, Pie. I also have a Doughnut Chart which I am going to use in our example.

Getting Started
npm install chart.js ng2-charts

// Add the following line to index.html
<script src="node_modules/chart.js/src/chart.js"></script>

// Add ChartsModule to your module
import { ChartsModule } from 'ng2-charts';

// In your App's module:
imports: [
   ChartsModule
]
We have done all the necessary work to properly install the chart. Next we need to use it. It’s dead simple to use it.
<canvas baseChart
    [data]="doughnutChartData"
    [labels]="doughnutChartLabels"
    [chartType]="doughnutChartType"
    [options]="donutOptions"
  ></canvas>
doughnutChartLabels = ['Download Sales', 'In-Store Sales', 'Mail-Order Sales'];
doughnutChartData = [350, 450, 100];
doughnutChartType = 'doughnut';
donutOptions: any = {
legend: {
display: true,
position: 'right'
}
};The [chartType] property sets which kind of chart you want to use. Next proved some labels and chartdata in the form of arrays. You can choose from doughnut, line, bar and more. Then I have set some options to show labels on right. You can find all the options at chartjs documentation.
I have set some options to show labels on right. You can find all the options at chartjs documentation.
Preview
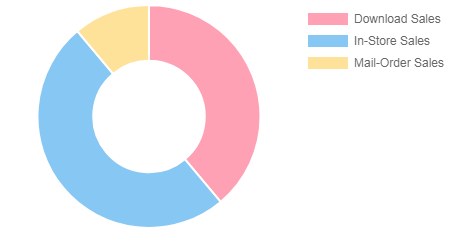
That’s how it looks and that’s how we add chart to your Ionic app. I personally felt some challenges when trying to add dynamic data. I will write separate article on how I manage to provide dynamic data to my chart.
One reply on “How to add Chart to your Ionic Angular App”
[…] B: Then visit back and you have all the information you […]